Asian Paints.
Asian Paints and the Future of Competitive Advantage in the Indian Paint Industry
RESEARCH SNAPSHOT
- Company
- Asian Paints
- Sector / Market
- Consumer / India
- Research focus
- Strategy, finance, marketing and sustainability
Contents 17 sections
Abstract
Asian Paints provides a useful case for understanding how an established consumer business responds when its familiar advantages face a changing competitive environment. This paper examines the relationship between the company’s strategy, marketing, financial performance and sustainability through a descriptive case study. It uses publicly available company disclosures, competitor filings and established management literature. The main financial comparison covers FY2023–24 to FY2025–26, with the June 2026 quarter discussed separately. Calculations use consolidated figures and clearly distinguish reported values from analytical estimates. The evidence shows a substantial decline in profitability in FY2024–25 followed by a partial recovery in FY2025–26. Revenue returned slightly above its FY2023–24 level, but profit remained below that earlier peak. The paper argues that defending leadership requires more than advertising or manufacturing scale: the customer’s experience, channel reliability, capital discipline and credible environmental measurement must work together. It also finds that expanding into home décor creates opportunities for a broader customer relationship while introducing execution and capital-allocation risks. The conclusions are analytical rather than causal because the study has no original interviews, survey responses or internal company data. Recommendations focus on customer outcomes, selective diversification, transparent performance measurement and sustained investment in the core paint business.
Keywords: Asian Paints; competitive advantage; brand equity; Indian paint industry; financial performance; sustainability; case study.
1 Introduction
Paint is an ordinary purchase with unusually lasting consequences. A customer may buy it only occasionally, but the colour, finish and durability remain visible every day. Choosing paint also involves more than choosing a tin from a shelf. The customer needs advice, a suitable product, surface preparation, an applicator and confidence that the finished result will match expectations. This makes the paint business an interesting meeting point between manufacturing, marketing and service delivery. A technically sound product can disappoint when it is applied badly, while a memorable advertisement cannot compensate for an unavailable shade or an unresolved complaint.
Asian Paints is particularly useful for studying these connections because it operates across decorative coatings, international markets, industrial coatings and home décor. Its FY2025–26 digital annual report describes an extensive manufacturing and customer-facing system, including 74 Beautiful Homes stores. These disclosures establish the company’s scale and breadth; they do not, by themselves, establish the profitability or customer satisfaction of every activity. The question for this paper is therefore how these different parts of the business contribute to a defensible position, rather than whether the company is simply large or well known. (Asian Paints, 2026e)
The competitive setting has also changed. Grasim’s November 2025 filing states that commercial production began at the Kharagpur plant on 15 October 2025, completing six Birla Opus facilities with installed decorative-paint capacity of 1,332 million litres per year. Capacity is not the same as production, sales or market share, but this disclosure demonstrates the scale of a serious entrant. It challenges the assumption that manufacturing investment alone prevents competition. A strong incumbent must ask what remains distinctive when another firm can fund plants, launch products and recruit channel partners. (Grasim Industries, 2025)
The financial record makes this question more interesting. A company can remain operationally important while experiencing pressure on revenue, margins or returns. This paper therefore avoids treating market leadership as proof of uninterrupted financial strength. It considers the weak FY2024–25 outcome alongside the FY2025–26 recovery and asks whether the improvement restores earlier performance or merely reverses part of the decline. This distinction matters because describing every rebound as success can conceal how much ground still needs to be recovered.
My central argument is that Asian Paints’ competitive position should be understood as a connected system of customer trust, product availability, service quality and disciplined investment. Each element becomes more valuable when the others work well. The paper evaluates this argument through several theoretical perspectives, a transparent financial comparison and a critical reading of environmental disclosures. It is written as a research-based company study, with the evidence and the limits of that evidence visible throughout.
2 Research Problem and Objectives
The research problem is whether an established paint company can protect the quality of its earnings and customer relationships while responding to stronger competition and expanding beyond its original category. Business growth, brand visibility and environmental commitments are often discussed separately. In practice, they affect one another. For example, a service promise may strengthen the brand but require extra operating costs, while a new business may increase customer access but compete with the core business for management attention.
The study has four objectives. The first is to identify plausible sources of competitive advantage and evaluate how easily competitors could reproduce them. The second is to examine how branding, distribution and service design influence the customer proposition. The third is to assess the direction and quality of financial performance using comparable consolidated data. The fourth is to evaluate sustainability claims with attention to their measurement boundaries and practical business implications.
Four research questions guide the analysis. RQ1 asks which capabilities appear most important to Asian Paints’ competitive position. RQ2 asks how marketing and service delivery can protect customer preference in a more competitive market. RQ3 asks what the FY2023–24 to FY2025–26 financial record indicates about resilience and recovery. RQ4 asks how sustainability can support long-term competitiveness without allowing broad claims to replace measurable outcomes.
These questions are exploratory. The paper does not propose statistical hypotheses because its available evidence cannot support a credible causal test. Instead, it develops reasoned explanations, considers alternatives and identifies the information needed to test the explanations in future research.
3 Literature Review and Analytical Framework
3.1 Competitive structure
Porter’s framework directs attention beyond direct competitors to the wider forces that shape profitability. It is used here as an organising lens rather than a quantitative model. (Porter, 2008) The useful question is who can influence the division of value in a painting project: the manufacturer, raw-material supplier, dealer, contractor or customer. A manufacturer may have substantial recognition yet still face pressure when channel partners have credible alternatives. Conversely, a fragmented customer base does not automatically guarantee pricing freedom if competing products are easy to compare.
For this case, the framework helps distinguish a growing market from an attractive profit opportunity. Additional capacity can create pressure even when long-term demand remains promising. The paper’s application asks how competitive spending, product availability and bargaining relationships could affect earnings. These are interpretive questions; the study does not claim to have measured the strength of each force through interviews or market-level econometric data.
3.2 Resources and competitive advantage
Barney’s resource-based view connects sustained advantage with resources that are valuable, rare, difficult to imitate and difficult to substitute. (Barney, 1991) This encourages a closer examination of what a company owns and what it can repeatedly do. A physical plant is visible and can potentially be reproduced. A reliable pattern of forecasting, delivery, technical support and complaint resolution may be harder to recreate because it depends on several routines and relationships working together.
The framework is useful, but it should not be applied by declaring every strength a permanent advantage. A resource can be valuable without being rare. Advertising expenditure, software purchases and product breadth are available to well-funded rivals. The more demanding test is whether a capability creates an observable customer or cost benefit that competitors struggle to match. This paper treats the existence of a durable advantage as a proposition requiring evidence, not an automatic consequence of company size.
3.3 Brand equity and customer choice
Keller explains customer-based brand equity through the influence of brand knowledge on consumer responses. Awareness and associations matter because customers do not encounter every product as an unfamiliar option. (Keller, 1993) In a paint purchase, a recognised name may reduce perceived uncertainty about quality, suitability or accountability. However, recognition and preference are different outcomes. A customer can remember a brand and still choose another because of price, availability, an applicator’s recommendation or a disappointing earlier experience.
This distinction informs the marketing analysis. The relevant outcome is not only whether consumers notice a campaign, but whether the company earns a favourable decision under actual purchase conditions. The paper therefore proposes evaluating the brand through project completion, complaint handling and repeat recommendation alongside awareness. These proposed measures are analytical recommendations; they are not results from a consumer survey conducted for this study.
3.4 Adaptation and dynamic capabilities
Teece, Pisano and Shuen emphasise the processes through which firms combine and adapt resources in changing environments. Their approach draws attention to organisational routines, asset positions and the paths through which capabilities develop. (Teece et al., 1997) For an incumbent, a successful past can provide useful knowledge while also encouraging habits that become less effective when competition changes. Adaptation therefore involves deciding which strengths to preserve and which assumptions to reconsider.
Applied to Asian Paints, this perspective helps evaluate diversification, service expansion and changes in the customer proposition. The analytical issue is whether the company can transfer useful knowledge into adjacent activities while learning the distinct economics of those activities. A recognised paint brand may help attract interest in décor, but it does not remove the need for category-specific execution. The framework supports a careful examination of change rather than a presumption that entering more categories always improves resilience.
3.5 Case study logic and environmental measurement
Eisenhardt’s work on case research stresses the connection between questions, evidence and theory development. (Eisenhardt, 1989) This study draws on that discipline while using a narrower design: it is one publicly documented company case, not a multi-case theory-building project. Its contribution is a transparent interpretation of relationships across business functions. It cannot establish a general rule for every manufacturer or replace research based on customers and channel participants.
Environmental analysis requires an additional measurement perspective. The GHG Protocol distinguishes direct emissions, purchased-energy emissions and other value-chain emissions, while its product standard addresses life-cycle impacts. (WRI and WBCSD, 2011a) This helps prevent the paper from equating improvements in factory electricity with improvements across the entire product system. Together, the selected frameworks connect external competition, internal capability, consumer interpretation, organisational adaptation and environmental accountability. None is sufficient alone, but their combination makes the company study more coherent.
3.6 The gap addressed by this study
The gap addressed here is an analytical one: a company study can describe a strong brand, list financial ratios and repeat sustainability highlights without explaining how those findings relate. This paper brings them into one case analysis and asks whether they support the same conclusion about competitive strength. It does not claim to be the first study of Asian Paints or to exhaust the existing literature. Its specific contribution is to connect customer outcomes and strategic fit with a reproducible recovery comparison, while examining the definitions behind environmental claims. This approach produces questions that future primary research can test rather than treating a descriptive company profile as a causal explanation.
4 Research Methodology
4.1 Design and scope
The study uses a descriptive and interpretive single-company case design based entirely on secondary evidence. The main period is FY2023–24, FY2024–25 and FY2025–26. In this paper, FY2025–26 means the year ending 31 March 2026. A separate update covers the quarter ending 30 June 2026. Keeping the quarterly update outside the annual comparison prevents a seasonal observation from being treated as equivalent to a full year. The research cut-off is 1 October 2026.
The unit of analysis is Asian Paints’ business model and consolidated financial performance. Standalone figures are discussed only when their scope is explicitly identified. This matters because the parent company and the consolidated group are not interchangeable. The same rule applies to sustainability: a measure covering decorative manufacturing plants cannot automatically be described as a group-wide outcome.
4.2 Sources and selection
The core sources are Asian Paints’ audited consolidated financial statements, annual-report sections and quarterly press release. A Grasim exchange filing provides independent evidence of the scale of a major entrant’s manufacturing expansion. Academic and standards sources provide the analytical frameworks. Sources were selected because they supplied traceable financial data, explicit business disclosures or established conceptual definitions. Unattributed market-share estimates, promotional rankings and unverified social-media commentary were not used as analytical inputs.
Corporate disclosures are primary evidence of what the company reports. They are not neutral descriptions of every customer or competitor experience. Their factual contents therefore receive more weight than their promotional language. Financial audit opinions are also kept separate from assurance of non-financial information. The presence of an audited annual report does not mean that every narrative claim within it has been independently verified to the same standard.
4.3 Extraction and analysis
Financial values were transcribed from the source tables and checked against their units and row labels. FY2023–24 and FY2024–25 figures come from the FY2024–25 consolidated results; FY2025–26 comes from the later audited consolidated statements. Common-year values were checked for consistency. The analysis calculates year-on-year growth, margins, indexed performance and the remaining gap relative to FY2023–24. Appendix A gives definitions so a reader can reproduce the calculations.
The qualitative analysis groups evidence under competitive capability, customer proposition, diversification and sustainability measurement. For each theme, the paper distinguishes the reported observation from its proposed implication. For example, an entrant’s installed capacity is an observation; the possibility of stronger bargaining pressure is an interpretation. This separation keeps a plausible explanation from being mistaken for a directly observed result.
4.4 Reliability and research ethics
The study reports rounded calculations to two decimal places and retains source precision in its underlying data. It makes no claim to have conducted interviews, questionnaires, experiments or statistical significance tests. No respondent quotations, sample sizes or p-values are invented. Recommendations are presented as proposals arising from the case analysis, not as proven solutions. The interactive scenario is an educational sensitivity exercise and does not represent a forecast or management guidance.
A reproducible approach improves reliability but cannot eliminate the limitations of public data. The paper does not observe individual transactions, dealer-level incentives or the profitability of each service project. It also cannot independently allocate every movement in earnings to competition, demand, pricing or input costs. Where more than one explanation is possible, the discussion leaves that uncertainty visible.
5 Company Context and Business Model
Asian Paints’ business is best understood by following the value delivered to a customer. Product development determines the suitable coating, manufacturing determines consistency, distribution determines availability, and application determines the visible result. Marketing connects these activities to expectations. The company’s FY2025–26 report presents decorative and home décor, international and industrial businesses as major business groupings. This paper uses those categories for context while recognising that corporate presentation categories are not necessarily identical to statutory segment definitions. (Asian Paints, 2026e)
The relationship between these activities creates both opportunity and dependence. A premium product can justify a higher price only when its benefits are credible and the purchase experience supports them. A wide product range can help a dealer meet several needs but also complicate inventory and training. Services can bring the manufacturer closer to the customer while exposing the brand to failures that occur during project execution. These relationships are the paper’s interpretation of the business model rather than claims about undisclosed internal systems.
Diversification into home décor extends the possible customer relationship beyond repainting. The strategic logic is understandable: a person improving a home may also need lighting, fittings, furnishings or design assistance. Yet a shared customer does not make every category economically similar. Different products have different replacement cycles, working-capital requirements and service expectations. The evaluation must therefore examine whether the company can create value across categories without losing attention to the operational strengths that support its core paint business.
6 Strategy and Competitive Position
6.1 Manufacturing scale and the limits of entry barriers
Grasim’s capacity disclosure changes how an incumbent’s position should be evaluated. A well-funded entrant has shown that substantial installed capacity can be assembled. (Grasim Industries, 2025) The inference is not that Asian Paints’ position has disappeared. It is that manufacturing scale alone is an incomplete explanation for its resilience. The more relevant question concerns which advantages remain effective after a competitor has built plants and introduced a broad product portfolio.
An entrant must still convert capacity into economical production, sustained sales and customer acceptance. A plant’s potential output says little about utilisation, distribution productivity or repeat demand. Consequently, it would be misleading to convert the disclosed capacity figure directly into an assumed revenue share. A careful strategy study should track these stages separately: installed capacity, actual production, channel placement, customer purchase and profitable repeat business.
This separation also clarifies the incumbent’s response. Matching every visible investment can lead to unnecessary expenditure. A better response would compare customer needs and operating bottlenecks with the resources already available. If the constraint is service reliability, another factory may not solve it. If the constraint is availability in a particular region, a national advertising campaign may not solve it either. Strategic spending should address an identified problem rather than simply mirror a competitor’s announcement.
6.2 Distribution as a service capability
For this paper, distribution is evaluated as the ability to deliver the promised product when and where it is needed. Outlet count is an incomplete measure of that ability. A network can be large while still suffering from slow replenishment, unavailable pack sizes or inconsistent technical guidance. Equally, a smaller but dependable network may provide a better experience for a particular customer group. This interpretation applies the resource-based lens to the quality of execution. (Barney, 1991)
A useful assessment would therefore combine availability with inventory efficiency. Maintaining excessive inventory can improve immediate availability while tying up cash and increasing the risk of obsolete stock. Too little inventory can improve a financial ratio while weakening customer service. The objective is a balanced system rather than the maximisation of a single operational measure. Suggested indicators include fulfilment reliability, stock-out frequency, the age of channel inventory and the speed of resolving delivery-related complaints.
The study does not have the internal data needed to score Asian Paints on these indicators. Their value is that they specify how a claimed distribution advantage could be tested. A future study could compare regions, outlet types or product categories while controlling for local demand. This would move the analysis beyond the vague statement that an established network is automatically a permanent competitive barrier.
6.3 Diversification and strategic fit
Diversification is attractive when capabilities can be transferred economically. Customer knowledge, a recognised brand and existing project relationships may reduce the difficulty of introducing an adjacent offering. However, these benefits need to be demonstrated through conversion, contribution and customer satisfaction. A visitor to a décor store is not automatically a profitable customer, and a completed cross-sale is not automatically a durable relationship.
The June 2026 quarter provides a useful reminder of the varied economics within home décor. The company’s release reports different outcomes for bath fittings, kitchens, White Teak and Weatherseal, including losses in some activities. These disclosures are quarterly observations rather than a complete appraisal of long-term potential. (Asian Paints, 2026f) Their analytical value is that they discourage treating the entire adjacency portfolio as one uniformly successful activity.
The recommendation arising from this evidence is selective expansion. Each category should have a clear customer problem, a plausible connection to the core capabilities and a route to acceptable returns. Management should be able to explain why ownership creates more value than a partnership or referral arrangement. The burden of proof should rise when the new category requires unfamiliar service skills or substantial capital. This approach preserves room for experimentation while preventing expansion from becoming an end in itself.
6.4 Risk and resilience
Resilience means retaining the ability to serve customers and invest through difficult conditions. It does not mean avoiding every decline in earnings. The three-year financial record suggests that Asian Paints remained profitable while its performance changed substantially. The interpretation is that resilience and stability should be separated. A resilient business may recover after a shock, but the recovery can still take time and leave earlier returns unrecovered.
Several risks deserve attention in a paint-company analysis: demand timing, raw-material costs, the behaviour of channel partners, project quality and the consequences of expanding into unfamiliar activities. Their relative importance cannot be established from this study alone. The practical response is to monitor a small number of linked operating and financial indicators so that apparent growth does not obscure deteriorating cash conversion or service quality.
7 Marketing and Consumer Relationships
7.1 Understanding the purchase
The marketing challenge begins with the fact that the buyer’s desired outcome is a satisfactory space. The physical product is one means of achieving that outcome. A customer may need help with colour, surface condition, expected durability, total project cost and the selection of an applicator. This is a conceptual description of a paint purchase, not a finding from original consumer interviews.
It follows that communication should address uncertainty at each stage. Before purchase, the customer needs understandable product comparisons. During purchase, the customer needs reliable availability and a realistic estimate of the work. During application, expectations need to match the substrate, preparation and workmanship. After completion, the customer needs a clear route for support. A brand can lose credibility when it performs strongly at the first stage but weakly at the last.
Keller’s framework helps explain why familiar associations can ease the decision. (Keller, 1993) The paper’s extension is to connect those associations with the actual project experience. A promise of quality is strengthened when the company can explain its limits honestly. Unrealistic assurances may create an immediate sale while increasing the chance of dissatisfaction. A marketing system should therefore be judged partly by whether it prepares the customer to make a suitable choice.
7.2 Segmentation and the customer proposition
A useful segmentation approach would begin with the situation rather than only the customer’s income. A budget repaint, a premium renovation, a dampness repair and an industrial maintenance project involve different decision criteria. Some customers need the lowest initial cost. Others may accept a higher price in exchange for appearance, durability or a more convenient service. The same message will not explain value equally well in all these situations.
This paper proposes presenting benefits in terms that customers can evaluate. Coverage should be accompanied by application conditions. A durability claim should distinguish product performance from surface preparation and workmanship. Waterproofing should explain the underlying problem it addresses rather than simply imply that every water-related defect has the same solution. These recommendations follow from the need to reduce uncertainty, not from an assumption that customers are unable to understand technical information.
Segmentation also has operational consequences. A broad range requires trained staff who can explain the differences without making every premium option sound identical. If a customer cannot understand the reason for a higher price, discounting becomes the easiest way to close the sale. A clear proposition can protect value by making the product’s suitability visible rather than relying on the brand name alone.
7.3 Advertising and the evidence of effectiveness
Asian Paints’ FY2025–26 business review describes product innovation and brand-building activity, including cricket-related visibility. These are reported initiatives, not independently measured effects on sales. (Asian Paints, 2026b) A research paper should not assume that a widely seen campaign caused the financial recovery. Sales can change because of demand timing, pricing, product mix, input costs and several other influences.
The more useful question is what evidence would connect an initiative with a meaningful outcome. Suggested measures include qualified enquiries, conversion into completed projects, the share of customers who correctly understand a product benefit and the persistence of preference after promotional support ends. A campaign could improve recall without changing conversion. Another could create fewer enquiries but attract customers with a clearer need and better retention.
For an undergraduate study, this distinction matters because marketing reports often celebrate exposure while saying little about incremental value. The proposed evaluation would compare similar locations or customer groups before and after an initiative, while recognising the difficulty of isolating a single influence. Without that design, the appropriate conclusion is that the activity supports a plausible brand strategy, not that its commercial effectiveness has been proven.
7.4 Services and customer accountability
Services can make a brand more useful by reducing the coordination burden of a painting project. They can also create a larger responsibility for the outcome. When customers purchase a managed service, they are likely to associate delays, unclear estimates or inconsistent work with the company whose name they trusted. Service expansion therefore requires the organisation to connect its communication with execution and recovery.
The relevant measures should cover the complete project. Time taken to provide an estimate, the difference between estimated and final cost, completion reliability and the speed of resolving defects would give a more complete picture than enquiry volume alone. Repeat recommendation is useful, but it should be examined alongside complaint patterns because an average score may conceal poor experiences in a particular location or contractor group.
The paper recommends viewing service quality as part of marketing investment. Spending on training and complaint handling may lack the visibility of an advertisement, but it can protect the credibility of future promises. This is an analytical proposition that future customer research should test. The strongest evidence would come from tracking customer expectations, completed outcomes and subsequent purchase behaviour over time.
8 Financial Findings
8.1 Comparable financial evidence
Table 1 uses consolidated figures throughout. Revenue means revenue from operations, including other operating revenue. Group profit after tax includes non-controlling interests; profit attributable to owners is shown separately. This distinction prevents two different profit measures from being used as though they were identical. FY2025–26 revenue from operations is calculated by adding product revenue, service revenue and other operating revenue in the audited statement. (Asian Paints, 2025) (Asian Paints, 2026a)
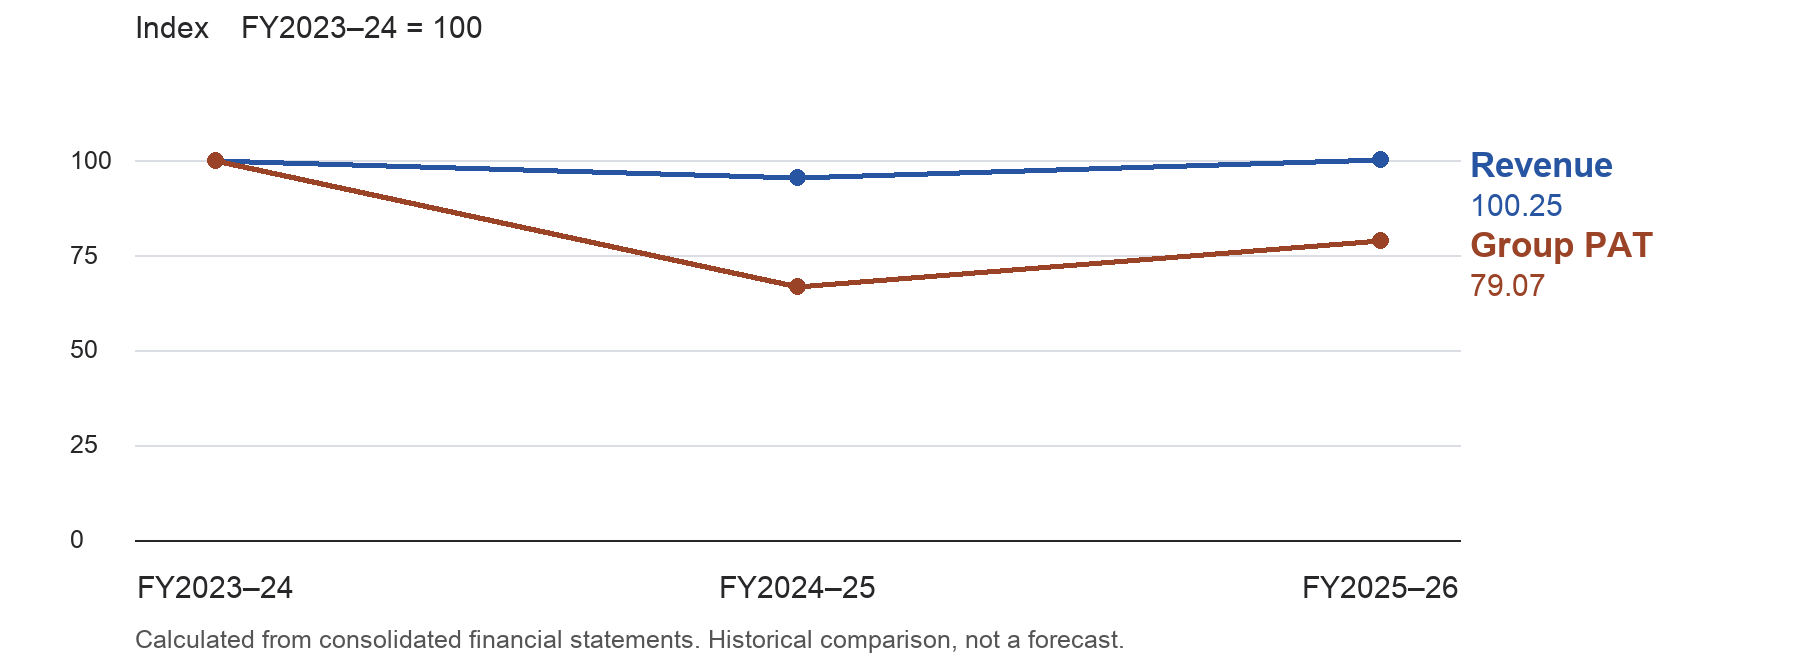
Revenue recovered faster than profit.
Group PAT includes non-controlling interests. PAT margin is group PAT divided by revenue from operations. Historical comparisons do not establish the causes of change.
| Metric | FY2023–24 | FY2024–25 | FY2025–26 |
|---|---|---|---|
| Revenue from operations | 35,494.73 | 33,905.62 | 35,583.54 |
| Group profit after tax | 5,557.69 | 3,709.71 | 4,394.69 |
| Profit attributable to owners | 5,460.23 | 3,667.23 | 4,325.35 |
| Reported EBITDA including other income | 8,272.94 | 6,578.82 | 7,419.72 |
| Group PAT margin | 15.66% | 10.94% | 12.35% |
| Basic earnings per share in INR | 56.95 | 38.25 | 45.12 |
Table 1. Consolidated financial comparison. Amounts are INR crore unless specified. Group PAT includes non-controlling interests. EBITDA includes other income.
The values establish a clear sequence: deterioration in FY2024–25 followed by recovery in FY2025–26. Revenue fell by 4.48% in FY2024–25 and then rose by 4.95%. Group profit after tax fell by 33.25% and subsequently increased by 18.46%. These are calculations from the disclosed values, not estimates of the reasons for the movements. The comparison is more informative than examining only the final year because it reveals the starting point from which the recovery occurred.
8.2 The difference between recovery and restoration
A rebound can look stronger when the comparison year is unusually weak. In FY2025–26, revenue from operations stood only 0.25% above its FY2023–24 level. Group profit after tax was still 20.93% below the FY2023–24 level. Profit attributable to owners was also below its earlier peak. This means the latest annual improvement should be described as a partial earnings recovery rather than a complete restoration of the earlier performance.
The margin comparison supports that interpretation. Group PAT divided by revenue from operations was 15.66% in FY2023–24, 10.94% in FY2024–25 and 12.35% in FY2025–26. The latest margin improved by 1.41 percentage points from the weak year but remained 3.31 percentage points below FY2023–24. A percentage-point change is different from a percentage growth rate; keeping the language precise avoids exaggerating the magnitude of improvement.
These results do not identify a single cause. Competition may be relevant, but demand, pricing, product mix, input costs, expenditure and exceptional items can also affect reported profit. The evidence therefore supports a statement about the direction and extent of recovery. It does not support a claim that one competitor or one management initiative explains the entire financial pattern.
8.3 Earnings definitions and the quality of comparison
The audited FY2025–26 statement reports EBITDA of INR 7,419.72 crore. Its calculation includes other income. Subtracting other income of INR 723.80 crore gives INR 6,695.92 crore as an analytical operating-earnings proxy before interest, depreciation and tax. The corresponding FY2024–25 proxy is INR 6,006.21 crore. These definitions are stated because an earnings label can conceal a different calculation base. (Asian Paints, 2026a)
The paper does not equate this proxy automatically with every company-reported operating margin or PBDIT measure. Denominators can differ, particularly between net sales and revenue from operations. The interactive scenario uses the proxy only as a transparent starting point. It helps a reader understand how changes in revenue and margin interact, but it cannot predict net profit because it excludes financing, depreciation, tax, exceptional items and other complexities.
Profitability should also be assessed beside liquidity and capital use. The FY2025–26 financial review reports a consolidated current ratio of 2.2, debt–equity ratio of 0.106 and interest coverage of 72.2 under the company’s definitions. (Asian Paints, 2026d) These indicate reported balance-sheet and coverage measures, but they do not establish that every future investment will be attractive. Strong coverage provides capacity; the quality of the investment determines whether that capacity creates value.
8.4 The June 2026 quarterly update
The release for the quarter ended 30 June 2026 reports consolidated net sales of INR 10,521.4 crore, up 17.9%, and net profit after minority interest of INR 1,539.3 crore, up 40.0%. It also reports Indian decorative-business volume growth of 9.0% and value growth of 16.6%. These are company-reported quarterly figures and are deliberately kept outside Table 1. (Asian Paints, 2026f)
The quarter strengthens the evidence of an improving recent direction, but it does not establish the outcome for FY2026–27. Seasonal demand, the prior-year base and later movements in costs or pricing can change the annual result. Value growth exceeding volume growth is consistent with some combination of pricing and mix effects; it does not identify their individual contributions. A careful assessment would require additional quarters and a consistent explanation of those drivers before concluding that the earlier margin level has become sustainable again.
9 Sustainability and Governance
9.1 Why measurement boundaries matter
Sustainability is relevant to this business because production, raw materials, packaging, transport and application can create environmental effects. A useful evaluation must identify the activity and boundary being measured. A factory-level reduction, a group-level reduction and an intensity improvement are different statements. An intensity measure can improve while total emissions rise if production expands sufficiently. The GHG Protocol provides the conceptual distinction between operational and value-chain emissions. (WRI and WBCSD, 2011a)
This paper prioritises specific indicators over broad claims of environmental leadership. The FY2025–26 environmental section reports a 56.5% renewable-electricity share across factories and describes reductions of 34% in Scope 1 and 33% in Scope 2 emissions at decorative manufacturing units since FY2013–14. It separately describes a roughly 69% reduction in emission intensity. These measures have different meanings and must remain separate. (Asian Paints, 2026c)
There is also a disclosure ambiguity worth recording. The digital annual-report overview labels a 69.2% figure as an absolute Scope 1 and 2 reduction, while the detailed environmental narrative associates approximately 69% with intensity and gives lower individual absolute reductions. This study does not resolve that inconsistency. It uses the more explicit detailed narrative and avoids treating the headline figure as a verified absolute reduction. This illustrates why checking the underlying definition matters as much as repeating a favourable number. (Asian Paints, 2026e) (Asian Paints, 2026c)
9.2 Water stewardship and local risk
The environmental section reports water replenishment equivalent to 589% of freshwater consumption. It explains that the estimate uses rainwater-harvesting structures outside plants and methodologies applied by NGO partners. The same section identifies the groundwater blocks around Patancheru and Cuddalore as water stressed under the cited 2025 assessment. (Asian Paints, 2026c) These disclosures should be read together rather than allowing a large replenishment ratio to end the analysis.
A replenishment estimate does not automatically demonstrate that water is available at the same site, at the same time or with the same quality as water consumed in operations. The paper’s interpretation is that local water resilience needs site-level evidence. Relevant questions include whether an intervention serves the affected basin, how seasonal availability changes and whether the estimated benefit persists. A company can make valuable community investments while still facing a material local operating risk.
The recommended evaluation would combine replenishment with withdrawal, consumption, water stress and the reliability of estimated benefits. It should also distinguish community benefits from the direct reduction of industrial consumption. This does not dismiss replenishment projects; it gives them a more precise role. Clearer boundaries would make it easier for students, communities and investors to understand both the achievements and the remaining exposure.
9.3 Product and value chain responsibility
Environmental improvements become more persuasive when they relate to the customer’s use of the product. The GHG Protocol’s product standard provides a life-cycle perspective rather than limiting attention to the manufacturing site. (WRI and WBCSD, 2011b) Applied to paint, a useful evaluation would consider raw materials, transport, application conditions, expected service life and end-of-life treatment. This paper does not have the product-level data needed to make a comparative life-cycle claim for a specific Asian Paints coating.
Durability can matter because a product that performs for longer may change the frequency of repainting. However, a longer service life should be demonstrated under comparable conditions before it is used to claim a lower environmental impact. Surface preparation, exposure and workmanship can affect the outcome. A product-level comparison should therefore make its assumptions visible rather than describe all premium or water-based products as automatically superior in every environmental dimension.
The same discipline applies to packaging. Recycled content is useful information, but a complete evaluation should also consider the amount of packaging per unit sold and what happens after use. Suggested future indicators include verified collection outcomes, material traceability and the proportion of returned packaging that reaches an appropriate recovery process. These are proposed research questions, not results from a waste audit performed for this paper.
9.4 Governance and the credibility of evidence
Governance connects sustainability with the broader quality of decision-making. Public reporting becomes more useful when the organisation explains accountability, definitions and assurance coverage. The financial auditor’s report explicitly distinguishes the audited financial statements from other information. (Asian Paints, 2026a) This reinforces the need to avoid assuming that an audit of the financial statements certifies every environmental or strategic assertion.
For this case, good governance would support consistent metrics across summary pages, detailed sections and future reporting periods. It would also explain changes in boundaries, methodology or targets. Such consistency is valuable because a reader otherwise cannot know whether an apparent improvement reflects better performance or a different calculation. The paper recommends treating disclosure quality as part of operational discipline rather than only a communication exercise. Transparent limitations can strengthen confidence more effectively than an impressive but ambiguous headline.
10 Integrated Discussion
The research questions are connected by a recurring issue: competitive advantage is valuable only when it produces outcomes that customers and the business can sustain. RQ1 points towards a system of execution rather than a single protected resource. Manufacturing scale is useful, but the entrant’s capacity disclosure shows why it cannot be the entire explanation. The analytical case for advantage is stronger when availability, advice and support reinforce one another in ways that are difficult to reproduce.
RQ2 places marketing inside that system. Advertising can create expectations and familiarity, but service delivery determines whether the promise survives a completed project. A customer-centred strategy would therefore examine the gap between the promise and the experience. The paper’s proposed indicators are designed to make that gap visible. They do not prove that Asian Paints currently performs better or worse than a rival on those dimensions.
RQ3 finds resilience with incomplete restoration. The company returned to revenue slightly above the FY2023–24 level in FY2025–26, while group profit remained materially lower. This is a stronger and more balanced conclusion than either describing the company as permanently weakened or declaring the recovery complete. The June 2026 quarter adds encouraging evidence, but the annual comparison remains the appropriate basis for judging the full-year recovery.
RQ4 shows that sustainability can support reliability and long-term value when the measures are credible. Resource efficiency, water resilience and product responsibility are connected to business continuity and customer trust. However, the reported environmental boundaries and the observed headline ambiguity require care. Sustainability should be assessed through clearly defined outcomes, not through the size of a selected ratio alone.
Together, these findings suggest that the strongest strategic response is coordinated. Premiumisation without a credible customer benefit can increase disappointment. Service growth without execution discipline can damage the brand. Diversification without category-level economics can conceal weak returns. Environmental promises without consistent definitions can undermine confidence. The company’s long-term position therefore depends on the fit among its activities as much as on the scale of any one activity.
11 Recommendations
11.1 Prioritise the complete customer outcome
Asian Paints should evaluate the customer journey from initial advice to post-project support. A practical first step would be to connect existing operating measures with completed-project measures, including estimate accuracy, completion reliability and complaint resolution. The objective is to understand where expectations fail, rather than simply increase the number of enquiries. Region-level analysis would help distinguish a widespread problem from a local execution issue.
These measures should inform training and product communication. Where recurring complaints concern preparation or suitability, improved advice may be more effective than additional advertising. Where the problem concerns workmanship, application standards and contractor support deserve attention. This recommendation follows from the paper’s interpretation of the purchase process; its effectiveness should be assessed through actual customer outcomes before wider implementation.
11.2 Make diversification earn further investment
Home décor categories should be evaluated individually, using measures that reflect their own economics. Revenue growth should be accompanied by contribution, working-capital needs and service obligations. A category that attracts customers but repeatedly consumes disproportionate capital needs a different response from one that is building profitable repeat business. Partnerships may sometimes provide customer access with less operating complexity than ownership.
The recommended approach is staged investment with explicit review points. Further spending should depend on evidence that the category solves a customer problem and improves the overall relationship economically. This prevents the breadth of the portfolio from becoming a substitute for its quality. It also leaves room to revise or exit an approach without treating every experiment as a commitment that must continue indefinitely.
11.3 Protect earnings quality during the recovery
The company should communicate the drivers of recovery in a consistent bridge between volume, pricing, mix, cost changes and exceptional effects wherever available. Investors and students need to understand why earnings improve, not only that they improve. The financial comparison in this paper demonstrates how a large growth rate from a low base can coexist with a remaining gap against an earlier year.
Internally, investment decisions should connect customer outcomes with returns and cash requirements. Strong coverage ratios provide flexibility, but flexibility should support selective decisions. The illustrative scenario also shows why revenue growth can be offset by a weaker operating margin. A balanced performance review should therefore resist rewarding growth that depends on excessive discounting, deteriorating cash conversion or poor project quality.
11.4 Improve sustainability comparability
The environmental reporting should make the baseline, boundary, numerator and denominator easy to locate for every major indicator. Summary claims should be reconciled with the detailed narrative, particularly for absolute emissions and intensity. Water reporting should explain how estimated replenishment relates to the locations where consumption and stress occur. These changes would improve the usefulness of the evidence without requiring readers to interpret ambiguous labels.
Product-level sustainability claims should be supported by relevant life-cycle evidence and comparable use conditions. Where data remain uncertain, the company can state what is known and what requires further measurement. Clear disclosure of limits is preferable to a broad claim that cannot be independently evaluated. Over time, a consistent reporting system would allow meaningful comparisons and reduce the risk that changes in methodology are mistaken for improvements in performance.
12 Limitations and Future Research
The study relies on public disclosures and therefore observes the business partly through management’s reporting choices. It has no direct evidence from customers, dealers, contractors, employees or suppliers. Its single-case design and short financial window limit generalisation. The paper cannot isolate the causal effects of competitive entry, advertising or service expansion, and it does not estimate market share. Calculated margins are historical descriptive measures rather than forecasts.
Future research should begin with the gaps identified in the case. A customer study could compare expectations with completed-project experience and later recommendation. A dealer study could examine the relationship between availability, incentives and brand preference. A category-level financial study could compare décor activities on consistent returns and working-capital measures. Each would require a clear sampling plan and transparent measurement before results could be generalised.
A longer industry study could compare several listed paint companies across common years and separate broad market conditions from company-specific changes. Product-level environmental research could examine life-cycle impacts under comparable application and service-life assumptions. Such work would strengthen or challenge the propositions developed here. The value of this paper is to make those propositions specific enough to investigate, while keeping its own evidential limits clear.
13 Conclusion
Asian Paints’ position cannot be understood through brand familiarity or manufacturing capacity alone. The case points towards the importance of connecting product quality, availability, service delivery and disciplined investment. A recognised brand creates an opportunity to earn trust, but the project experience determines whether that opportunity becomes a durable customer relationship. Diversification can broaden the relationship while also introducing new economic and operational demands.
The financial evidence shows a partial recovery after FY2024–25. FY2025–26 revenue from operations slightly exceeded FY2023–24, but profit remained below the earlier level. The June 2026 quarter indicates a stronger recent direction without settling the outcome for the next full year. Sustainability disclosures add another dimension to competitiveness, provided that absolute improvements, intensity measures and local resource risks are clearly distinguished.
The paper’s final judgement is that defending leadership requires consistent outcomes across the business. Customer experience, financial resilience and environmental accountability should be evaluated together. The most convincing evidence of future strength will be measurable improvements that persist beyond one campaign, one quarter or one favourable comparison base.
Appendix A Data Definitions and Reproducibility
| Measure | Calculation or definition |
|---|---|
| Year on year growth | 100 × (current year amount ÷ previous year amount − 1) |
| Group PAT margin | 100 × group profit after tax ÷ revenue from operations |
| Indexed performance | 100 × annual amount ÷ FY2023–24 amount |
| Operating earnings proxy | Reported EBITDA less other income |
| Scenario revenue | FY2025–26 revenue × (1 + selected growth ÷ 100) |
| Scenario margin | FY2025–26 proxy margin + selected percentage point change |
| Scenario operating earnings | Scenario revenue × scenario margin ÷ 100 |
What changes when growth and margin move?
An educational calculation using consolidated revenue and reported EBITDA less other income. This is not a forecast or company guidance.
All monetary figures in the financial comparison are in INR crore. One crore equals ten million rupees. Source amounts retain two decimal places; calculations use these amounts before rounding. Revenue from operations includes product and service revenue plus other operating revenue. PAT includes the group’s non-controlling interests; the separate owners’ profit row excludes them. Reported EBITDA includes other income in the audited statement’s presentation. The operating-earnings proxy subtracts other income, and should be read with its explicit definition.
The scenario takes FY2025–26 revenue from operations and the calculated operating-earnings proxy as its starting point. Users choose an illustrative revenue growth rate and a change in margin, measured in percentage points. The resulting amount is an educational sensitivity calculation. It assumes the selected margin applies to the selected revenue and omits a detailed cost model, financing, depreciation, tax and exceptional items. The scenario does not estimate probabilities, provide a valuation or recommend an investment.
Appendix B Evidence Map
| Question | Evidence used | Interpretation limit |
|---|---|---|
| RQ1 Capabilities | Business disclosures and Grasim capacity filing | No direct measurement of competitor execution |
| RQ2 Marketing | Brand theory and disclosed initiatives | No causal campaign evaluation or consumer survey |
| RQ3 Finance | Audited consolidated figures for three years | Historical comparison cannot isolate drivers |
| RQ4 Sustainability | Detailed environmental disclosures and GHG standards | Corporate reporting and boundary uncertainty |
The evidence map links the main questions to the information used and the limits on interpretation. All cited corporate materials are publicly available. The interactive version contains the same narrative, tables and references as the editable paper, with additional controls for exploring historical data and the illustrative scenario. The historical dataset is fixed at the research cut-off; it is not a live financial feed.
References
-
Asian Paints Limited. (2025). Consolidated financial results for the quarter and year ended 31 March 2025. View source. PDF page 17.
-
Asian Paints Limited. (2026a). Consolidated financial statements. Integrated annual report 2025–26. View source. Printed pages 462–463; PDF page 6.
-
Asian Paints Limited. (2026b). Business review. Integrated annual report 2025–26. View source. PDF page 1.
-
Asian Paints Limited. (2026c). Sustainable operations. Integrated annual report 2025–26. View source. Printed pages 114–115 and 124–125; PDF pages 2 and 7.
-
Asian Paints Limited. (2026d). Financial review. Integrated annual report 2025–26. View source. Printed pages 60–61; PDF page 1.
-
Asian Paints Limited. (2026e). Integrated annual report 2025–26 [Digital overview]. View source. At a glance and sustainable operations highlights.
-
Asian Paints Limited. (2026f, July 29). Q1 FY27 consolidated net sales at INR 10,521.4 crores up 17.9% [Press release]. View source. PDF pages 1–2.
-
Barney, J. (1991). Firm resources and sustained competitive advantage. Journal of Management, 17(1), 99–120. View source. Publisher abstract and bibliographic record.
-
Eisenhardt, K. M. (1989). Building theories from case study research. Academy of Management Review, 14(4), 532–550. View source. Publisher abstract and bibliographic record.
-
Grasim Industries Limited. (2025, November 5). Outcome of board meeting and unaudited financial results for the quarter and half year ended 30 September 2025 [Stock exchange filing]. View source. Standalone results note 12 on Kharagpur commissioning.
-
Keller, K. L. (1993). Conceptualizing, measuring, and managing customer-based brand equity. Journal of Marketing, 57(1), 1–22. View source. Publisher abstract and bibliographic record.
-
Porter, M. E. (2008). The five competitive forces that shape strategy. Harvard Business Review. View source. Publisher description of framework.
-
Teece, D. J., Pisano, G., & Shuen, A. (1997). Dynamic capabilities and strategic management. Strategic Management Journal, 18(7), 509–533. View source. Publisher abstract and bibliographic record.
-
World Resources Institute & World Business Council for Sustainable Development. (2011a). Corporate value chain Scope 3 accounting and reporting standard. View source. Chapter 5 on emission scopes.
-
World Resources Institute & World Business Council for Sustainable Development. (2011b). Product life cycle accounting and reporting standard. View source. Official product-standard description.
Good research leaves room for better questions.
Back to the research library